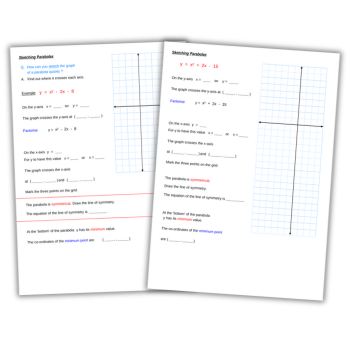
Practise sketching quadratic graphs by finding out where the graph crosses each axis. This worksheet contains simple examples using factorising. It also includes the line of symmetry and locating the minimum point.
Sketching quadratic graphs
The KS3 maths worksheet is about sketching quadratic graphs, specifically parabolas. It guides students through the process of:
- Identifying where the graph crosses the y-axis
- Finding the x-axis intersections by solving the quadratic equation
- Marking these points on a graph
- Drawing the line of symmetry of the parabola
- Determining the equation of the line of symmetry
- Identifying the minimum point of the parabola and its coordinates
The worksheet provides specific quadratic equations for students to practise these steps. It includes space for working out, plotting points and sketching the parabolas, reinforcing the symmetry and the concept of the vertex.
KS3 maths curriculum area
Algebra: Recognise, sketch and produce graphs of linear and quadratic functions of one variable with appropriate scaling, using equations in x and y and the Cartesian plane.
SKILLSHEETS are a series of 32 books of photocopiable worksheets designed to teach basic maths and English in a straightforward and understandable way. Find them on TES at Skillsheets.


