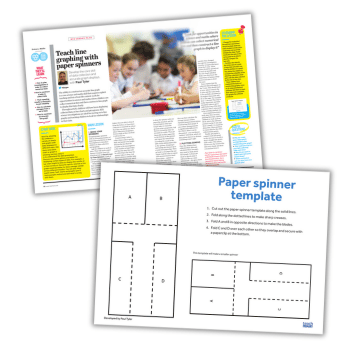
PDF lesson plan and paper spinner template
KS2
Years 3-6
Develop the core skill of data collection and accurate graph displays with this line graphs KS2 lesson plan…
The ability to construct an accurate line graph is a core science and maths skill that requires explicit teaching and lots of real-life context.
Look for opportunities in science and maths where children can collect numerical data and then construct a line graph to display that data clearly.
Throughout KS1, children will have been displaying collected data on bar charts and pictograms. KS2 science investigations are ideal for moving on to line graphs and teaching children to look for relationships in their data.
Line graphs KS2 learning objectives
- Plan investigations in order to collect numerical data
- Construct a table to collect data
- Learn that repeating results is necessary to get reliability
- Calculate averages from a set of data
- Construct an accurate line graph
Starter activity
Start by showing the children a variety of charts and graphs with data displayed in different ways. Ask them what each chart or graph is showing and how easy it is to understand the data presented.
Discuss why some options are better for displaying certain types of data. For example, a bar chart might be best to display the results of a class survey on favourite sports, whereas a line graph would be better to show average rainfall across different months.
You can also show pupils some ‘bad’ charts and graphs (you’ll find examples online) and ask what’s wrong with them.
Paul Tyler is a primary teacher and science specialist at Kirkhill Primary School in East Renfrewshire.


