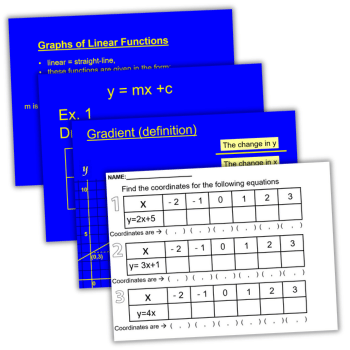
This PowerPoint introduces the topic of straight line graphs and focuses on understanding and plotting linear functions in the form y=mx+c.
PowerPoint straight line graphs lesson
- Coordinate the starter to begin with (make sure audio is turned on, as sound is embedded in slides)
- Phase 1: generate coordinates from functions
- Phase 2: plot the coordinates on worksheets
- Extension: Generate and plot coordinates for two non-linear functions
KS3 Maths Curriculum Area
Number Reduce a given linear equation in two variables to the standard form y = mx + c; calculate and interpret gradients and intercepts of graphs of such linear equations numerically, graphically and algebraically
Dave Wilson is a head of maths in Bury. You can find his resources on his TES page davewilson and you can follow him on X at @DLWilson_maths.


