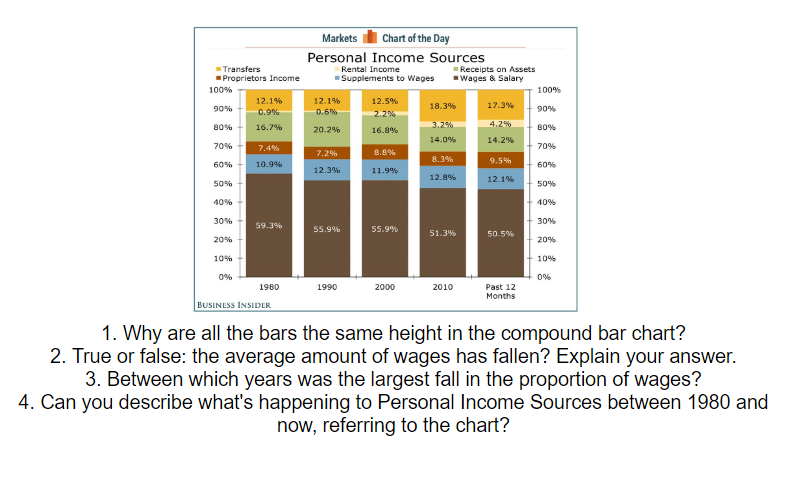
Using the ‘Chart of the Day’ page (linked) I have set some questions on real-life data.
I’m sure you could all come up with better questions, but hopefully this will give you a start.
KS3 Maths Curriculum Area
Statistics Construct and interpret appropriate tables, charts, and diagrams, including frequency tables, bar charts, pie charts, and pictograms for categorical data, and vertical line (or bar) charts for ungrouped and grouped numerical data
Andy Lutwyche is a purveyor of mathematics and a producer of resources, more of which you can find on his TES shop. You can also follow him on Twitter at @andylutwyche.


