How Pictures Promote Reasoning And Deepen Understanding In Maths
A picture may be worth a thousand words, but it can also be valuable in a maths classroom, says Mike Askew

- by Mike Askew
- Educator, researcher and speaker with a focus on primary maths education Visit website
I recently had the pleasure of taking part in a masterclass run by the innovative immersive theatre company Punchdrunk.
Their work is a mixture of improvisation and physical theatre (and they do wonderful projects with schools – see more information at the end of this article) and although I went mainly out of curiosity about how they develop their ideas, many of the activities that we did got me wondering about how some of the ideas explored might have implications for mathematics teaching and learning.
In particular, one of the exercises involved reacting to and engaging with the environment as the basis for creating a short scene. I and a partner worked out a dramatic moment between a captain and subordinate. Seeking advice from one of the facilitators on how we might improve our little dialogue, she suggested running the scene and doing the actions but cutting out all the talk.
My first reaction was to wonder how anyone would then know what was going on, but we tried it out. The impact was immediate. Even just running the scene for the two of us we could tell that it felt much more powerful and the response we got later from others watching it suggested that they too had sensed the tension we had been trying to bring into being. Just as interesting was the range of interpretations of what we had been conveying – many far richer than our original idea.
This may seem a long way from teaching mathematics in general and the impact of national tests in particular, but it reminded me of research I’d come across about the presentation of images and words alongside each other on the same page or whiteboard image.
The main message from the research was that images are best presented on their own: that a mix of words and images can be challenging for learners to process.
The cognitive science argument for this is that having to process two different types of visual input simultaneously – graphical and words – can overload the brain’s processing capacity.
In contrast, presenting images only and talking about them is easier to process: the brain can more easily cope with processing the visual and auditory simultaneously.
So while research evidence also shows that presenting graphical images and verbal descriptions together helps to develop understanding, it seems it is more helpful, whenever possible, to talk about images, rather than present written text alongside them.
Images first
I suspect that, not unreasonably, pupils taking tests probably attend first to the words – ‘really read the question’ is common advice – and only then turn to the images to help them answer the question. I want to suggest that a helpful teaching technique is to get pupils to engage with images first, to talk about what they can see in the images and then turn to the sort of questions that might be asked of the images.
To illustrate this let’s look at some of the types of images in the national tests and how these might be worked with, not only to help deepen learners’ understanding of key ideas but also to encourage them to think about the images as much as the wording that accompanies them.
KS1
Packets of straws
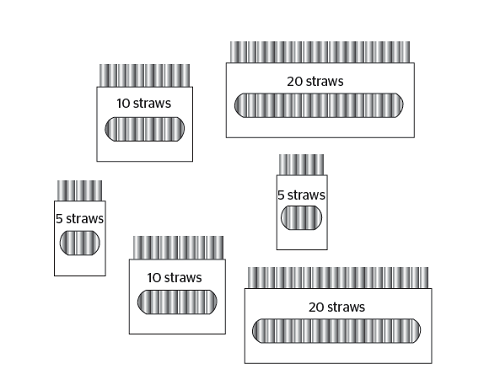
Take this image which is similar from one in the 2016 KS1 assessment. Putting such an image up, without any wording or questions attached, I would ask pupils what they notice. Having given them the opportunity to just talk about what they can see, I would lead the discussion, if these ideas had not already emerged, to talk about things like:
- There are six boxes altogether
- There are some boxes of five, some of ten, some of 20 straws
- There are twice as many straws in a box of ten than in a box of 5
- There are two of each type of box
I would then invite pupils to suggest questions that might be asked. I expect they would offer questions like:
- How many straws are there altogether?
- How many packets of five straws do you need to make the same number of straws as in the packets of 10?
If no one suggested it, I would pose the questions:
- Suppose two children were going to share the straws equally, what would be a good way for them to share them? And how many would they each get?
By now I would hope that the pupils could be able to talk about how each child could have one box each of five, 10 and 20. Now it’s a short step to saying each child would then get 35 straws.
Unpacking this question in this way is, I think, important, as it is on the KS1 reasoning paper. So although it could be answered by adding up the total number of straws, the expectation is that there must be a more efficient way of answering it.
Solid shapes
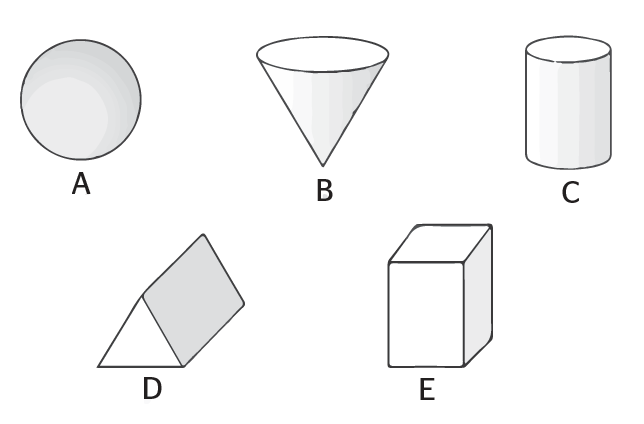
Here is another image similar to one on the reasoning paper. Again, before addressing any particular questions I would invite pupils to say what they notice or know about the shapes. What questions might be asked about the shapes? Things to discuss might include:
Trending
- Which shapes roll?
- Which faces have all sides the same?
- What are the names of the shapes?
- How many faces does each shape has? How many edges? How many corners (vertices)? How could these answers be checked?
- Where might these shapes be found around the classroom or at home?
Again, the particular question of which shape has exactly five faces could then be explored.
KS2
Fractions
I’ve written before about the difficulty with the popularly held idea that fractions can be ‘recognised’, and the problem inherent in the language of ‘recognition’ that somehow fractions exist without the essential question of a fraction of ‘what’? Take these two images for example.
Given the first image, most people when asked what fraction is black will say ‘one quarter’. The second is slightly more ambiguous – one quarter of the total number of squares is black, but if comparing black to white then the answer is one third.

This is also a perfectly acceptable answer to the first image – it is only convention that when the squares are joined we assume that the whole is all four squares, but it could be otherwise – there is nothing about the fractions 1/4 or 1/3 in and of themselves that determine the correct answer.
Instead we must pay attention to the answer to the question, ‘fraction of what?’. Fractions are constructed, not recognised.
Here is an image similar to the one on the KS2 2016 reasoning paper.
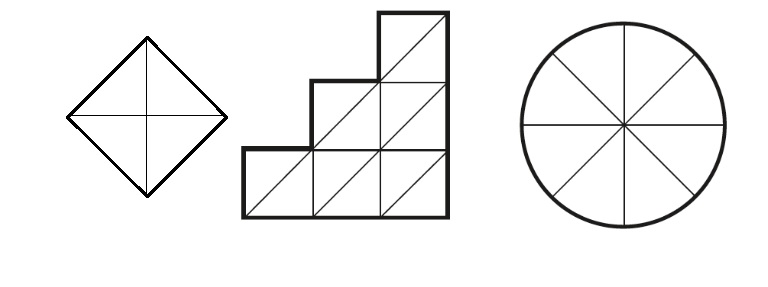
A first question I would ask of this image is what is the same and what is different about each diagram? I’d then ask learners to say which diagram they think is the odd one out.
Can they come up with reasons why each diagram might be the odd one out? (For example, the circle is the only shape with no right angles, the square is the only shape with four lines of symmetry, the steps is the only shape with angles greater than 90°, and so forth).
Turning the conversation to fractions, an interesting discussion could be had around the two questions:
- Without drawing in extra lines, what fractions could be shaded so that the same fraction is shown on each diagram?
- Without drawing in extra lines, what fractions could only be shaded on one or two of the diagrams, but not on the other(s)?
Finally, the test question of having to shade three-quarters of each diagram and the various ways of doing this could be discussed.
Angles
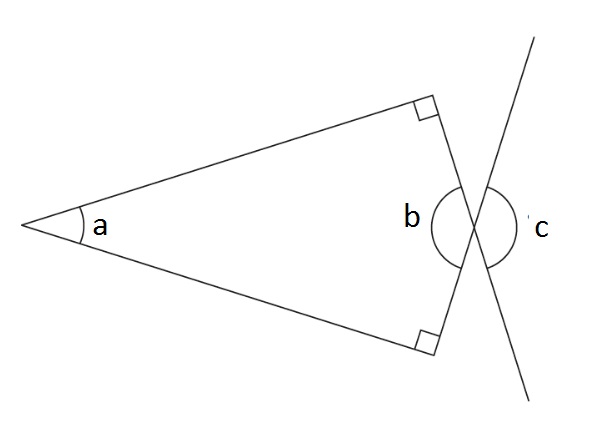
Here is another image like one from the 2016 KS2 reasoning papers. Before having a whole-class conversation about an image, it is helpful to get learners to talk in pairs about what they see, what they know, and what they can figure out. With this image, I’d ask:
- Turn to your neighbour and see what you can say about the lines and angles in this diagram.
Drawing on the learners’ responses, establish things like:
- The four interior angles of the quadrilateral must add to 360°
- Two of those angles are right angles, so the other two angles must add to 180°
- Angles b and c must be the same
If learners are not convinced that b and c must be the same, label one of the other two angles, d.
Establish that angles b and d added together must be 180° as they are on a straight line. Similarly, c and d must add to 180°. Since d is the same each time, b must be equal to c.
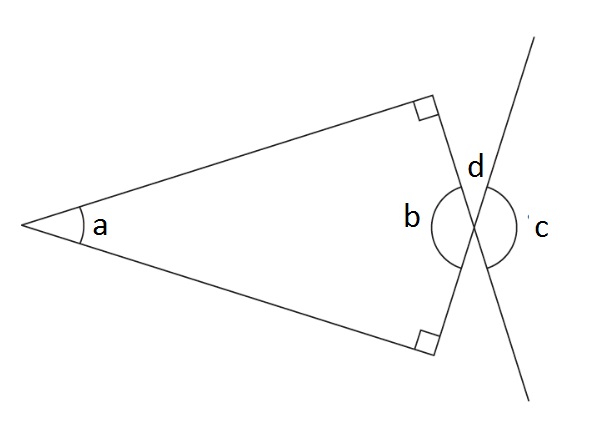
Now tell the pupils that b is 160°. What are a and c?
A thousand words
Played with in such ways, pictures might not only provoke a thousand words, but also a good number of mathematical ideas to provoke reasoning and deepen understand (and, as a bonus, perhaps help test scores!).
The lost lending library
The Lost Lending Library is a Punchdrunk enrichment project that uses a drama narrative that unfolds in school and has the aim of raising standards in literacy, speaking and listening. The Lost Lending Library can travel from place to place and arrives at the school in search of new books written by new writers: the pupils in the school. Find out more at punchdrunk.org.uk/the-lost-lending-library.
Mike Askew is adjunct professor of education at Monash University, Melbourne. A former primary teacher, he now researches, speaks and writes on teaching and learning mathematics. You can find him at mikeaskew.net or on Twitter at @mikeaskew26.


