Venn diagram probability – Why it can lead to confusion

In this lesson, students learn how probabilities can be calculated by using the correct regions of a Venn diagram…

- by Colin Foster
- Reader in mathematics education at Loughborough University Visit website
Calculating probabilities using Venn diagrams can often lead to confusion. Here, maths expert Colin Foster lays out a lesson plan that will set students straight…
What’s the issue with Venn diagrams and probability?
Here’s a problem to pose to pupils:
I want you to estimate the probability that if I select a person from this school at random, they will be a football player.
Students might be unsure what ‘at random’ means. We just mean that everyone has the same chance of being selected.
They might also query who counts as a ‘football player’ – someone who belongs to a team, or just someone who plays occasionally? These are good questions to ask, so agree on some definition.
Students might answer in words (e.g. ‘very likely’) or give fractions or percentages. Agree on some sensible value, such as 20%.
Now estimate the probability that if I select someone randomly from this school they will be a hockey player.
Now estimate the probability that if I select someone randomly from this school they will be either a football player or a hockey player.
See whether students think they should add the previous two probabilities or not.
The solution
Rather than our whole school, let’s imagine just a small class of 10 students. Here they are on a Venn diagram:
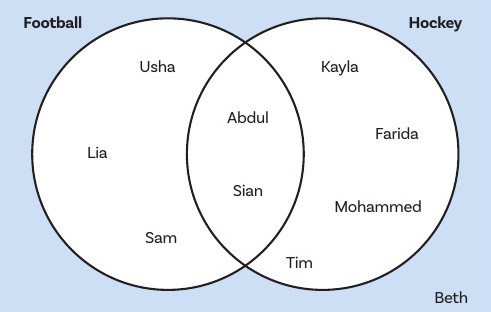
The Venn diagram tells us the following:
- Abdul does football and hockey
- Beth does neither football nor hockey
- Usha does football – and not hockey
Which is more popular – football or hockey? Hockey (6 people versus 5 for football).
If I select someone from the class at random, what’s the probability they will do football? Students might think that the answer is 3/5 or 3/10 , but it’s 5/10 = 1/2 = 50%.
To answer this they need to disregard whether someone plays hockey or not, which means completely ignoring the boundary created by the right-hand circle.
If I select someone from the class at random, what’s the probability they will do hockey? The answer is 6/10 = 3/5 = 60%.
If I select someone from the class at random, what’s the probability they will do either football or hockey? The answer can’t be 50% + 60%, because that would be more than 100%, which is impossible!
The answer is that 9 people do either sport, out of 10 people altogether, so the answer is 9/10 = 90%. Another way to see this is that it’s everyone except Beth, who is 1/10 of all of the people, so 9/10 of the people do at least one sport.
If I select someone from the class at random, what’s the probability they will do both football and hockey? This is just Abdul and Sian, and the probability of selecting either of them is 2/10 = 20%.
Checking for understanding
Make up a Venn diagram with two partially overlapping categories and 12 people altogether. Write the people’s names in whichever regions of the diagram you choose.
Make up six probability questions about your Venn diagram, similar to the ones you’ve seen in this lesson. Write out the answers clearly. See if your partner can answer your questions.
Colin Foster is a Reader in Mathematics Education in the Department of Mathematics Education at Loughborough University. He has written many books and articles for mathematics teachers. Visit his website.