Engage your Year 2 pupils with these tally chart worksheets. They’re designed to develop their understanding of tally charts, pictograms and block diagrams.
This activity-based worksheet introduces children to essential data-handling skills while keeping them entertained through a practical and relatable context.
With clear instructions and an engaging theme, this free downloadable resource is perfect for Year 2 teachers looking to enrich their maths lessons.
It’s ideal for classroom use or homework and you can easily adapt it for small group work or individual tasks.
Tally chart worksheets
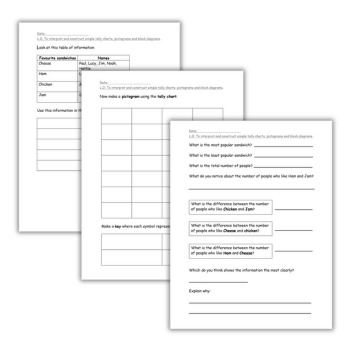
The resource begins by presenting a simple table showing favourite sandwich choices among a group of children. The worksheet tasks pupils with translating this data into a tally chart. This encourages them to practise their counting skills in a structured way.
Next, they use the tally chart to create a pictogram, complete with a key where each symbol represents two sandwiches. This step reinforces the concept of representing data visually, making it easier for young learners to interpret and analyse.
Final challenge
The final challenge invites children to construct a block diagram based on their pictogram. This hands-on task helps them understand how information can be represented in different formats.
As pupils progress, they answer questions about the data. For example, they need to identify the most and least popular sandwiches, calculate totals and explore differences between groups.
These activities encourage critical thinking and problem-solving, all while embedding key mathematical concepts in an enjoyable way.
The worksheet also asks pupils to reflect on which type of visual representation they found the clearest and to explain their reasoning.
This promotes deeper engagement and helps them understand the practical applications of statistics in everyday life.
The Teaching Couple have over a decade of experience in the education sector and provide advice and resources for teachers.


