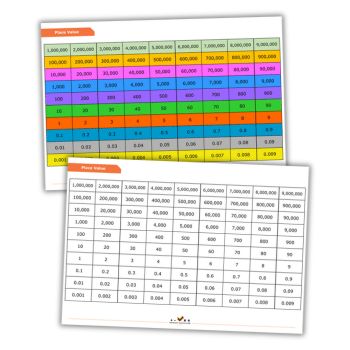
A Gattegno chart, named after educational theorist Caleb Gattegno, is a powerful tool to help KS2 students visualise and understand place value, multiplication and number relationships.
At its core, the Gattegno chart is a grid of numbers, typically showing multiples of 1 to 9 arranged vertically in columns. Each row progresses by powers of ten, so students see the progression of numbers in the tens, hundreds, thousands, and so on.
For example, a Gattegno chart might have 1, 10, 100, and 1000 all aligned in one column to show how the digits are positioned differently at each place value level.
Using a Gattegno chart in class
As a KS2 teacher, you can use a Gattegno chart in multiple ways to deepen students’ understanding of place value and operations.
Start by helping students explore patterns within the chart. Ask them to point to numbers in the same column to identify patterns in place value.
This helps students see that 100 is ten times 10, or that 2000 is ten times 200. Such visual reinforcement strengthens their comprehension of multiplication as scaling by powers of ten.
One effective strategy is to use the Gattegno chart to introduce multiplication and division. Show students how moving up a row multiplies a number by ten, while moving down divides it by ten.
This can also be a helpful way to introduce decimal numbers. Extend the chart to include tenths, hundredths, and thousandths, allowing students to observe how these smaller values relate to whole numbers.
More ideas
Another way to use the chart is for mental maths practice. Challenge students to identify patterns or complete number sequences.
For instance, ask questions like “What is 10 times 5?” or “If I start at 700, what do I get if I divide by 10 twice?”
By consistently engaging students in these types of questions, the Gattegno chart encourages flexible, mental manipulation of numbers.
You could also use the Gattegno chart to support students with place value problems they might encounter in real life.
For example, when discussing money, time or measurements, refer to the chart to illustrate the role of place value in these contexts.
Integrating a Gattegno chart into your KS2 maths lessons allows students to build a more robust number sense, making abstract concepts more concrete and understandable.
Primary Maths Hub was founded in 2022 by Sarah Farrell and Andrew Jennings and offers high-quality maths resources. Follow on X at @PrimaryMathsHub.


