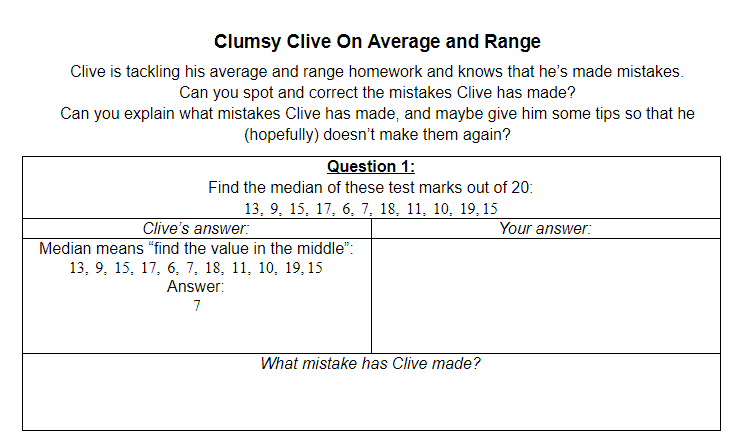
Five more questions that Clumsy Clive seems a bit confused on. These involve median and mean from sets of data, plus calculating the mean from a frequency table and estimating the mean from grouped data.
You can also throw a couple more questions in verbally (find the modal group etc) while discussing the answers and reasons why as a class.
KS3 Maths Curriculum Area
Statistics Describe, interpret and compare observed distributions of a single variable through: appropriate graphical representation involving discrete, continuous and grouped data; and appropriate measures of central tendency (mean, mode, median) and spread (range, consideration of outliers)
Andy Lutwyche is a purveyor of mathematics and a producer of resources, more of which you can find on his TES shop. You can also follow him on Twitter at @andylutwyche.


